PTV Visum (Visum) is a software system that allows you to model all private and public transport types in one single integrated model. It is complemented by the microscopic traffic simulation system PTV Vissim (Vissim). Using Visum, most basic data provided by transport information and planning systems can be managed consistently and maintained with the network editor. Unlike simple GIS systems, Visum allows complex relationships within single or several transport systems to be retained, enabling you to create a suitable transport model.
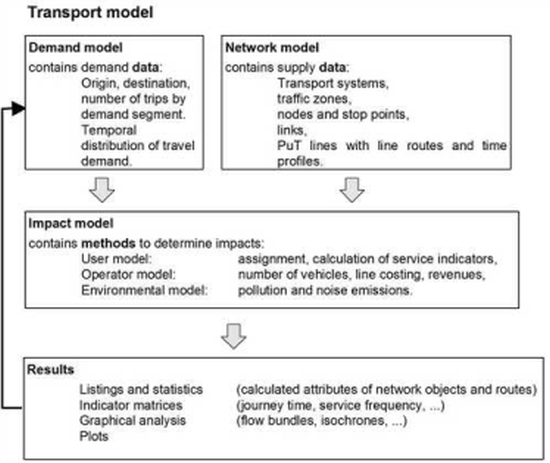
A transport model normally consists of a demand model, a network model based on Visum and various impact models (Illustration 1):
- The demand model contains travel demand data. Information on the demand within a planning area is required for the analysis of transportation networks. Demand matrices can only partially be created based on survey data. This is why mathematical models are used to reproduce real demand ratios. They allow you to calculate the traffic flows between zones of the planning area based on structure and behavior data, the spatial utilization structure and the transport system. Visum includes the Standard 4-step model, the EVA model, and the Tour-based model. Thus you can create your own travel demand matrices in the program (Demand model).
- The network model stores the transport supply-side. The network model consists of traffic zones, nodes, public transport stops, links representing roads and railway tracks, and the public transport lines with their timetables for classical transport systems. In addition, sharing stations or pick-up and drop-off nodes are needed to map new forms of mobility. Transport supply data can be visualized with Visum and edited interactively with different methods.
- The impact models use input data provided by the network model and the demand model. Visum offers several impact models for analysis and evaluation of transport supply. The user model simulates the travel behavior of public transport passengers and motor vehicle users (User model PuT and User model PrT). It calculates traffic volumes and service skims (such as journey time or number of transfers). An operator model determines operational indicators of a public transport service, like service kilometers, service hours, number of vehicles or operating costs (Operator model PuT). Revenues by ticket type derived from the demand data allow line related revenue estimates for a line costing calculation. An environmental impact model offers several methods to assess the impacts of motorized private traffic on the environment (Environmental impact calculation and HBEFA ).
- Visum displays the calculation results in graphical and tabular form and allows you to perform various graphical analyses of the results. You can e.g. display and analyze routes and connections per OD pair, flow bundles, isochrones and turning volumes at nodes. Indicators such as journey time, number of transfers, service frequency, and many more are computed as skim matrices.
- You can compare different versions using the version comparison or network merge functionalities. You can further exchange the changes made to your model via model transfer files.

Illustration 1: Visum network model and impact model
Like all models, a transport model represents an abstraction of the real world. The aim of the modeling process is system analysis, forecasting and model-based preparation for decisions taken in the real world.
In the following, especially the network data model and the procedures available in Visum are described and explained in a simple way.

